Mapping Project
- Home
- The Project
- Photographic Archive
- Heritage Trail
- Oral History
- Church Project
- Mapping Project
- Documents Archive
- Merchandising
- Links

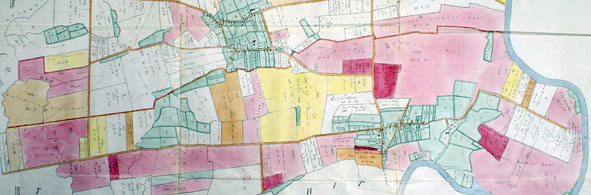
During the course of collecting photographs, we had been shown maps of the Village dating from various periods and in various scales, including some from the effects of Harry James, who died shortly after the Project had begun. It then occurred that here was a great opportunity that wasn’t thought of when we made the application, i.e. to show how Elston had evolved from its earliest beginnings as an Anglo Saxon settlement to today’s village.
An appeal was therefore placed in the Parish Magazine for someone to collect and copy maps of all periods and mount them in a folio of at least A3, possibly A2 size, so that they could be viewed at exhibitions. In addition a Powerpoint presentation was planned which would superimpose each new stage of development on what has gone before so that it would be possible to show an audience the process in a dynamic way and thus make it more intelligible. This would have to be built up from a series of digital images of individual maps and posed the question of uniformity of scale, as the presentation would be effective only if the viewer could see on the same map what was being added in relation to what already existed. So it would be necessary to copy extracts of the maps manually onto a standard template or to make a series of transparencies showing only the changes and additions at each stage, based on contemporary maps.
The first step was to acquire a copy of every historical map of the parish from people in the village, the Ordnance Survey, and the County Archive in Nottingham. In addition whenever a date was obtained, from contemporary or historical sources, for the erection, adaptation, or demolition of any building in the village, it was noted down. This information resulted in a list of building events which not only enabled some otherwise undated photographs to be dated, but could also be compared with historical maps to verify its accuracy.